
Diffuse large B-cell lymphoma (DLBCL) is the most common aggressive lymphoma worldwide, and roughly 40% of patients relapse or become refractory to standard R-CHOP chemotherapy. For these patients, CD20×CD3 bispecific antibodies represent one of the most promising new treatment classes. Glofitamab achieved a 52% overall response rate (ORR) and 39.4% complete response (CR) rate in relapsed/refractory DLBCL. Mosunetuzumab reached 80% ORR and 60% CR in follicular lymphoma.
These are impressive numbers. But they also raise an urgent question: which patients will respond, and which will not?
Today, bispecific antibodies are given without predictive biomarker stratification. There is no companion diagnostic to guide patient selection. The genomic, functional, and clinical evidence needed to design a biomarker-driven Phase III trial exists, but it is scattered across half a dozen databases, hundreds of publications, and thousands of adverse event reports.
In this case study, K-Dense Web was given a single prompt and built the entire biomarker discovery pipeline from scratch. It queried 6 live databases, wrote and executed 9 Python scripts, analyzed over 1,184 patient samples, and produced ranked biomarker recommendations with a complete Phase III statistical analysis plan. The session also generated a 34-page publication-ready white paper with 48 verified citations.
The Pipeline
K-Dense Web designed a 5-step workflow integrating multi-omic, preclinical, clinical, safety, and literature data into a single composite scoring framework.
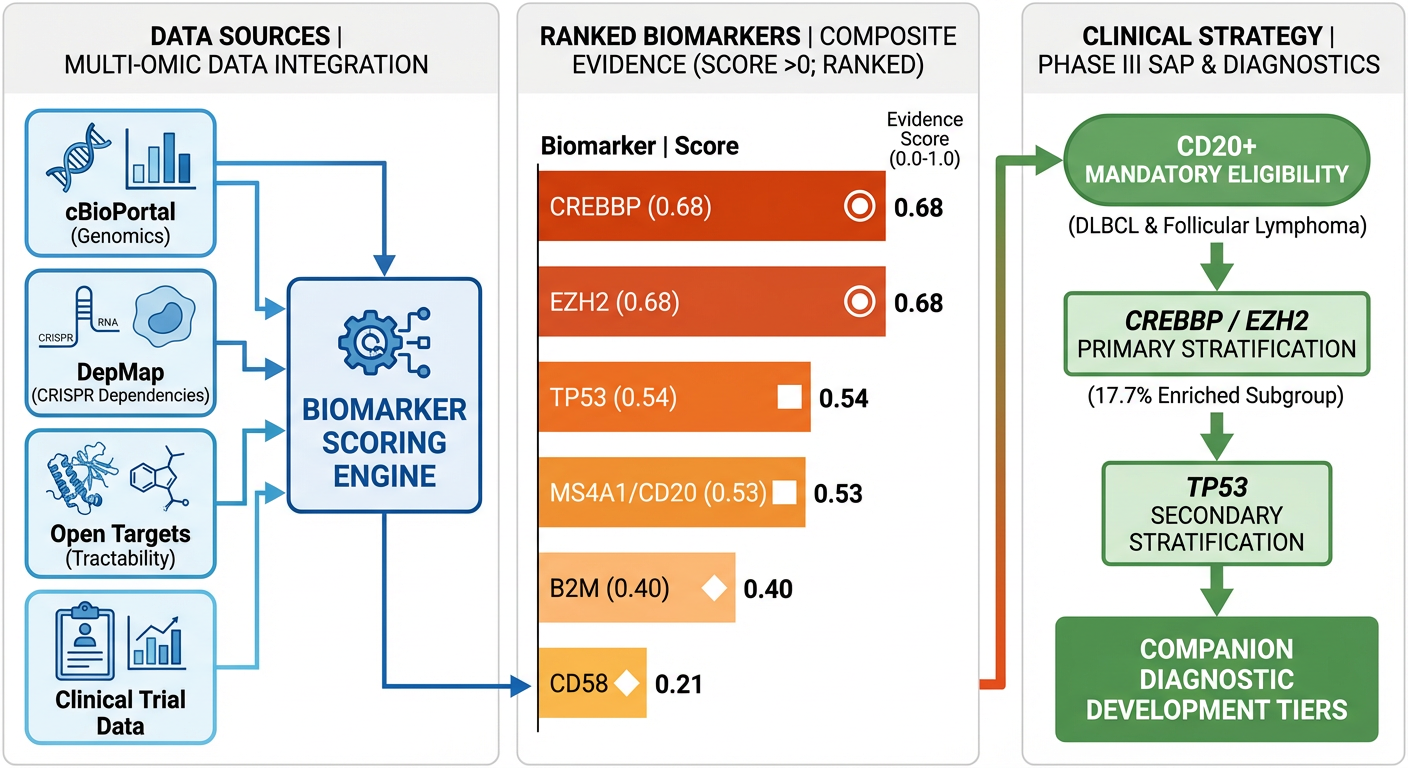
Graphical abstract: Multi-omic data sources feed into a composite scoring engine that ranks 6 candidate biomarkers and maps them to Phase III stratification roles.
Step 1: Multi-Omic & Preclinical Data. K-Dense Web queried the cBioPortal API for mutation and copy number data across 3 DLBCL studies (n=1,184 samples), then downloaded DepMap 26Q1 CRISPR gene effect scores for 145 B-cell lymphoma cell lines (56 with CRISPR data, 113 with expression data).
Step 2: Clinical, Safety & Target Validation. It mined Open Targets for disease association scores and drug candidates, pulled trial metadata and published efficacy from ClinicalTrials.gov, retrieved 130 PubMed articles on bispecific antibody biomarkers, and extracted adverse event counts from the FDA's FAERS database (2,622 total reports).
Step 3: Integration & Scoring. All data streams were merged into a gene-centric scoring matrix with four weighted components, then normalized and ranked.
Step 4: Visualization. Four publication-quality figures were generated automatically.
Step 5: Phase III SAP Synthesis. The final rankings were translated into stratification recommendations, companion diagnostic tiers, trial design parameters, and regulatory alignment guidance.
Every step was autonomous. K-Dense Web chose the APIs, designed the statistical tests, applied Benjamini-Hochberg FDR correction, and iterated on its own scoring methodology (correcting a prevalence calculation bug between v1 and v2 without being asked).
Genomic Landscape: Mutations Across 1,184 DLBCL Samples
The cBioPortal analysis revealed a clear hierarchy of mutation frequencies among the 6 candidate biomarker genes:
| Gene | Mutation Frequency | Altered Samples |
|---|---|---|
| CREBBP | 12.4% | 147 / 1,184 |
| TP53 | 10.9% | 129 / 1,184 |
| EZH2 | 6.0% | 71 / 1,184 |
| B2M | 6.0% | 71 / 1,184 |
| CD58 | 3.0% | 35 / 1,184 |
| MS4A1 | 0.0% | 0 / 1,184 |
CREBBP, a histone acetyltransferase and known epigenetic driver in germinal center lymphomas, had the highest mutation rate. MS4A1 (CD20), the bispecific antibody target itself, had zero somatic point mutations in these treatment-naive cohorts. In de novo DLBCL, CD20 is almost universally expressed and MS4A1 mutations are extremely rare. CD20 antigen loss typically emerges later, under selective pressure from anti-CD20 therapy, through a mix of acquired truncating mutations, transcriptional downregulation, and post-translational mechanisms (Schuster et al., Blood 2024).
The co-occurrence analysis identified one statistically significant gene pair after FDR correction: CREBBP and EZH2 (odds ratio = 3.04, FDR q = 0.0036). This is biologically coherent. Both are epigenetic regulators of the germinal center program, and their co-mutation suggests a convergent immune evasion phenotype.
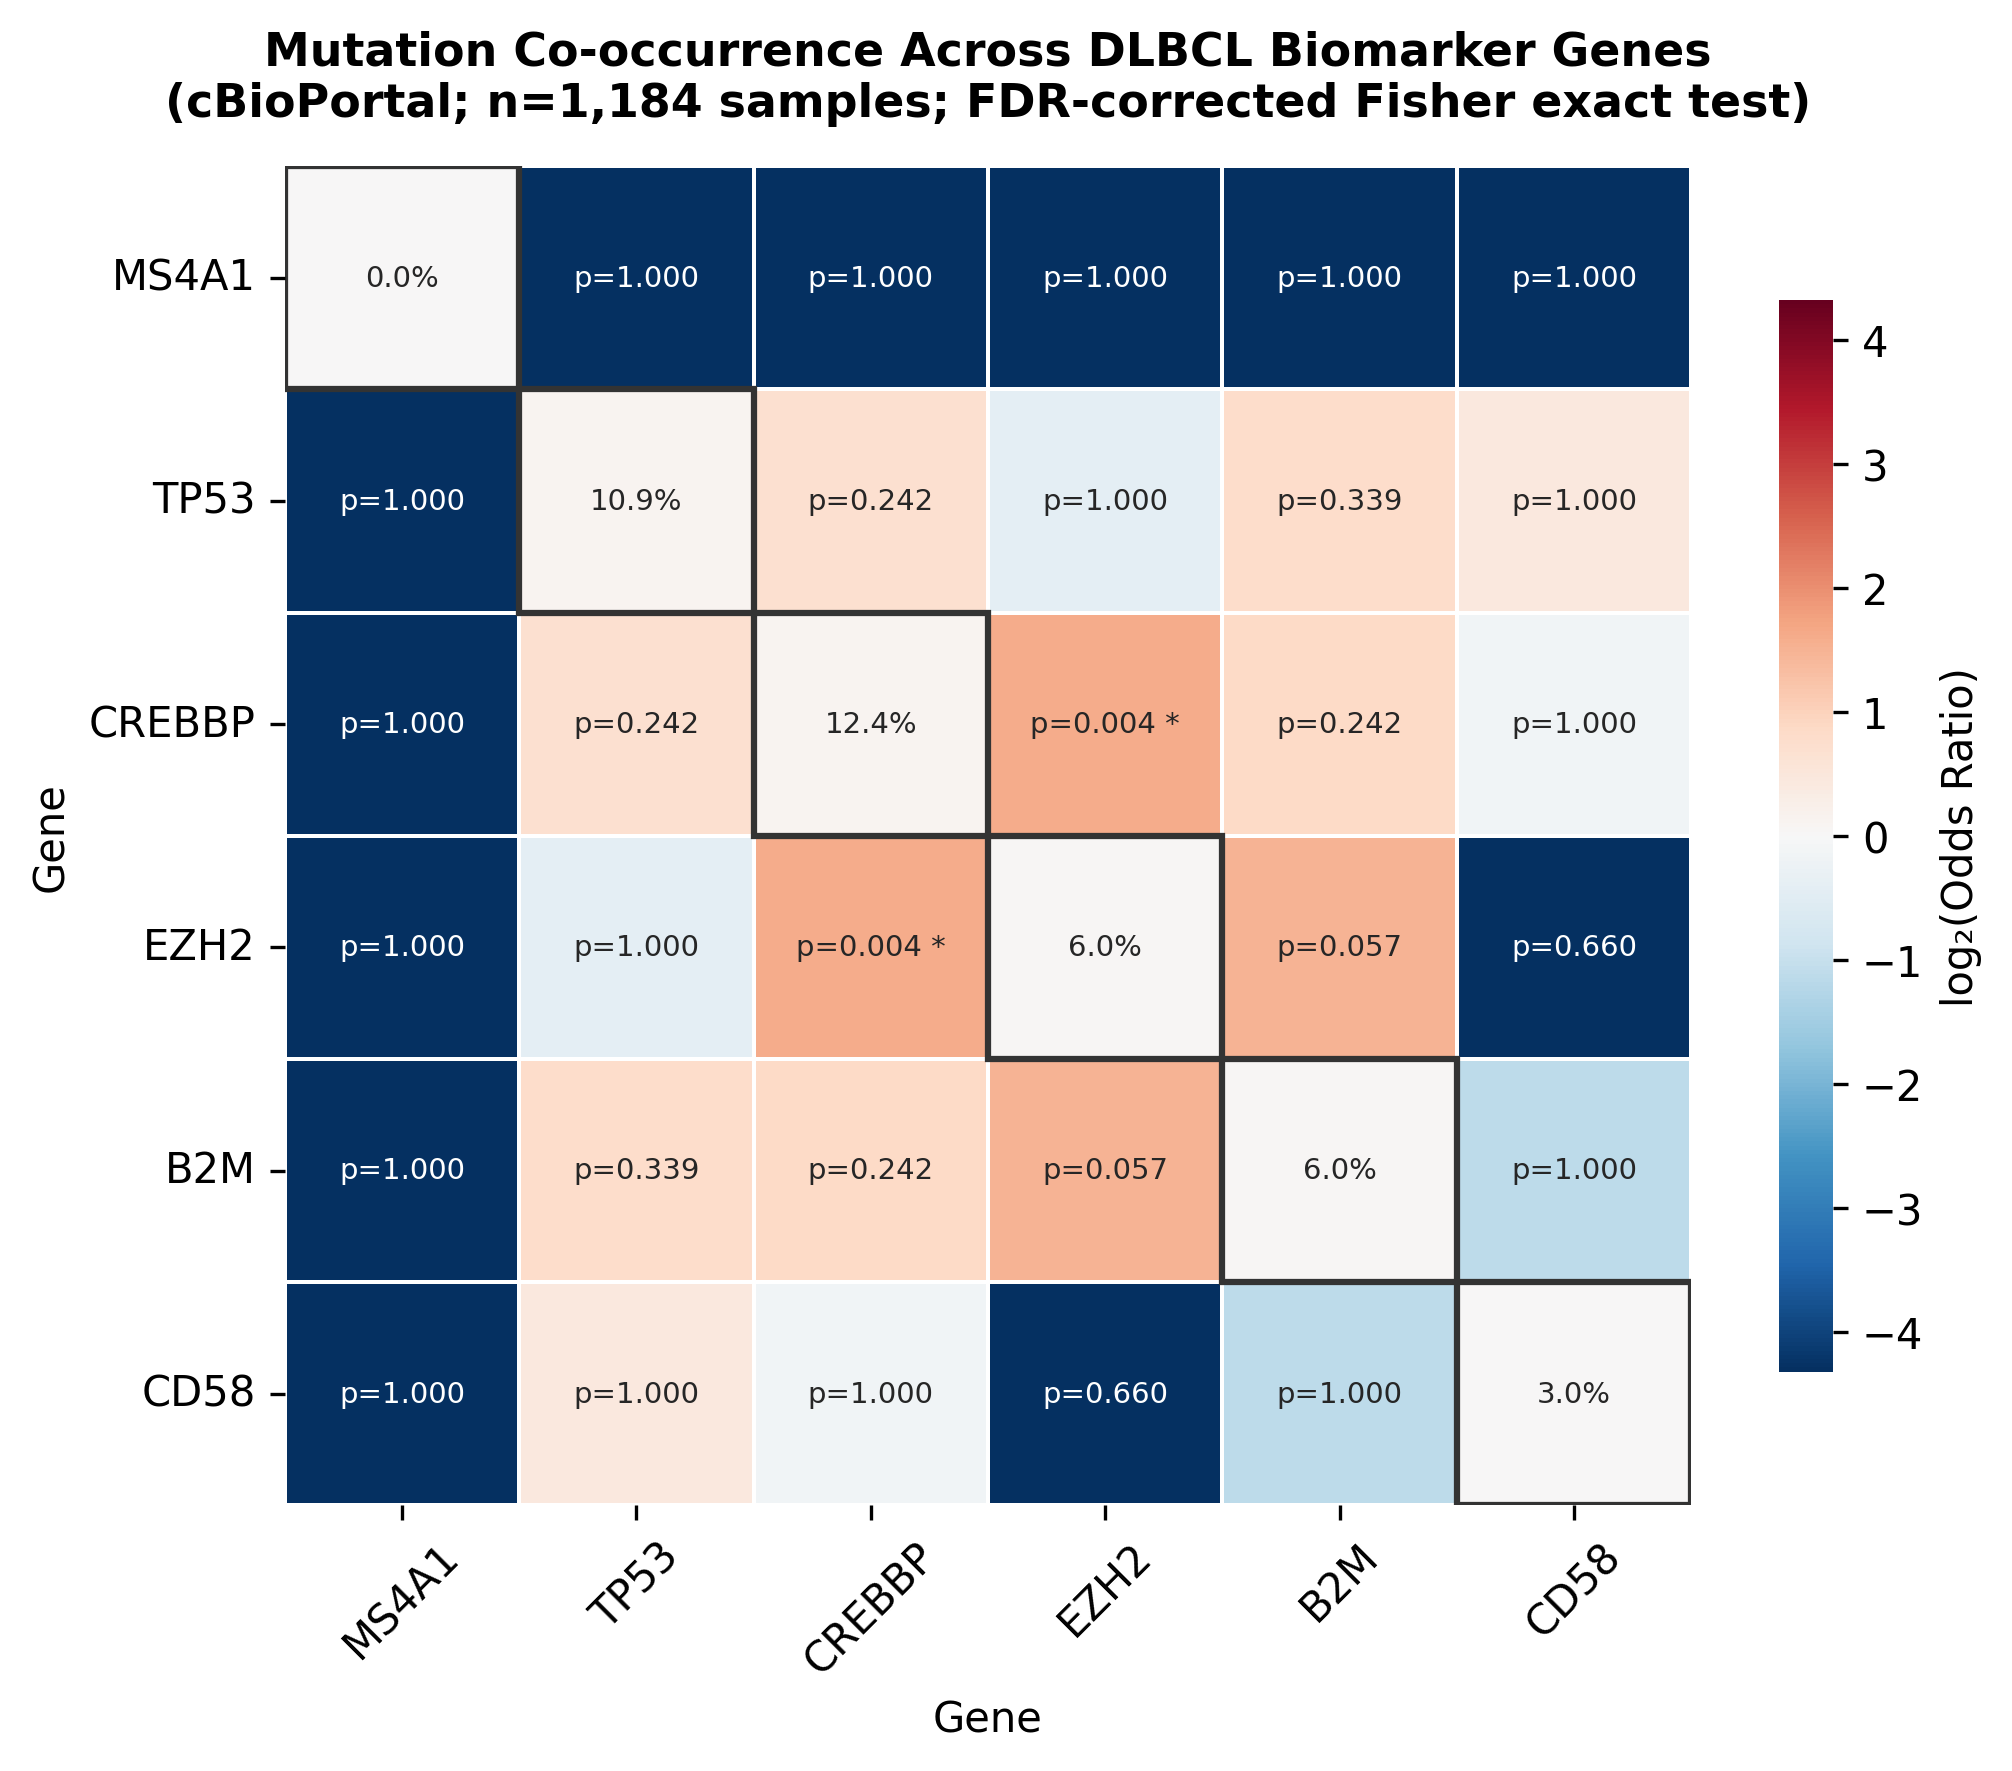
Co-occurrence heatmap across 1,184 DLBCL samples. Diagonal shows mutation frequencies. Only the CREBBP-EZH2 pair (FDR q = 0.0036) survives multiple testing correction.
Functional Dependencies: DepMap CRISPR Analysis
K-Dense Web downloaded DepMap 26Q1 data (over 700 MB) and filtered to B-cell lymphoma cell lines. It then stratified 113 lines into CD20-high (n=57) and CD20-low (n=56) cohorts based on median MS4A1 expression (log2(TPM+1) = 7.37) and tested whether CRISPR gene dependencies differed between groups.
EZH2 showed the strongest functional essentiality across all B-cell lymphoma lines (median Chronos score = -0.37, with 35.7% of lines classified as dependent). CREBBP was the second most essential (median = -0.15, 17.9% dependent). However, no dependency differences between CD20-high and CD20-low lines survived FDR correction, suggesting these genes act independently of CD20 expression level.
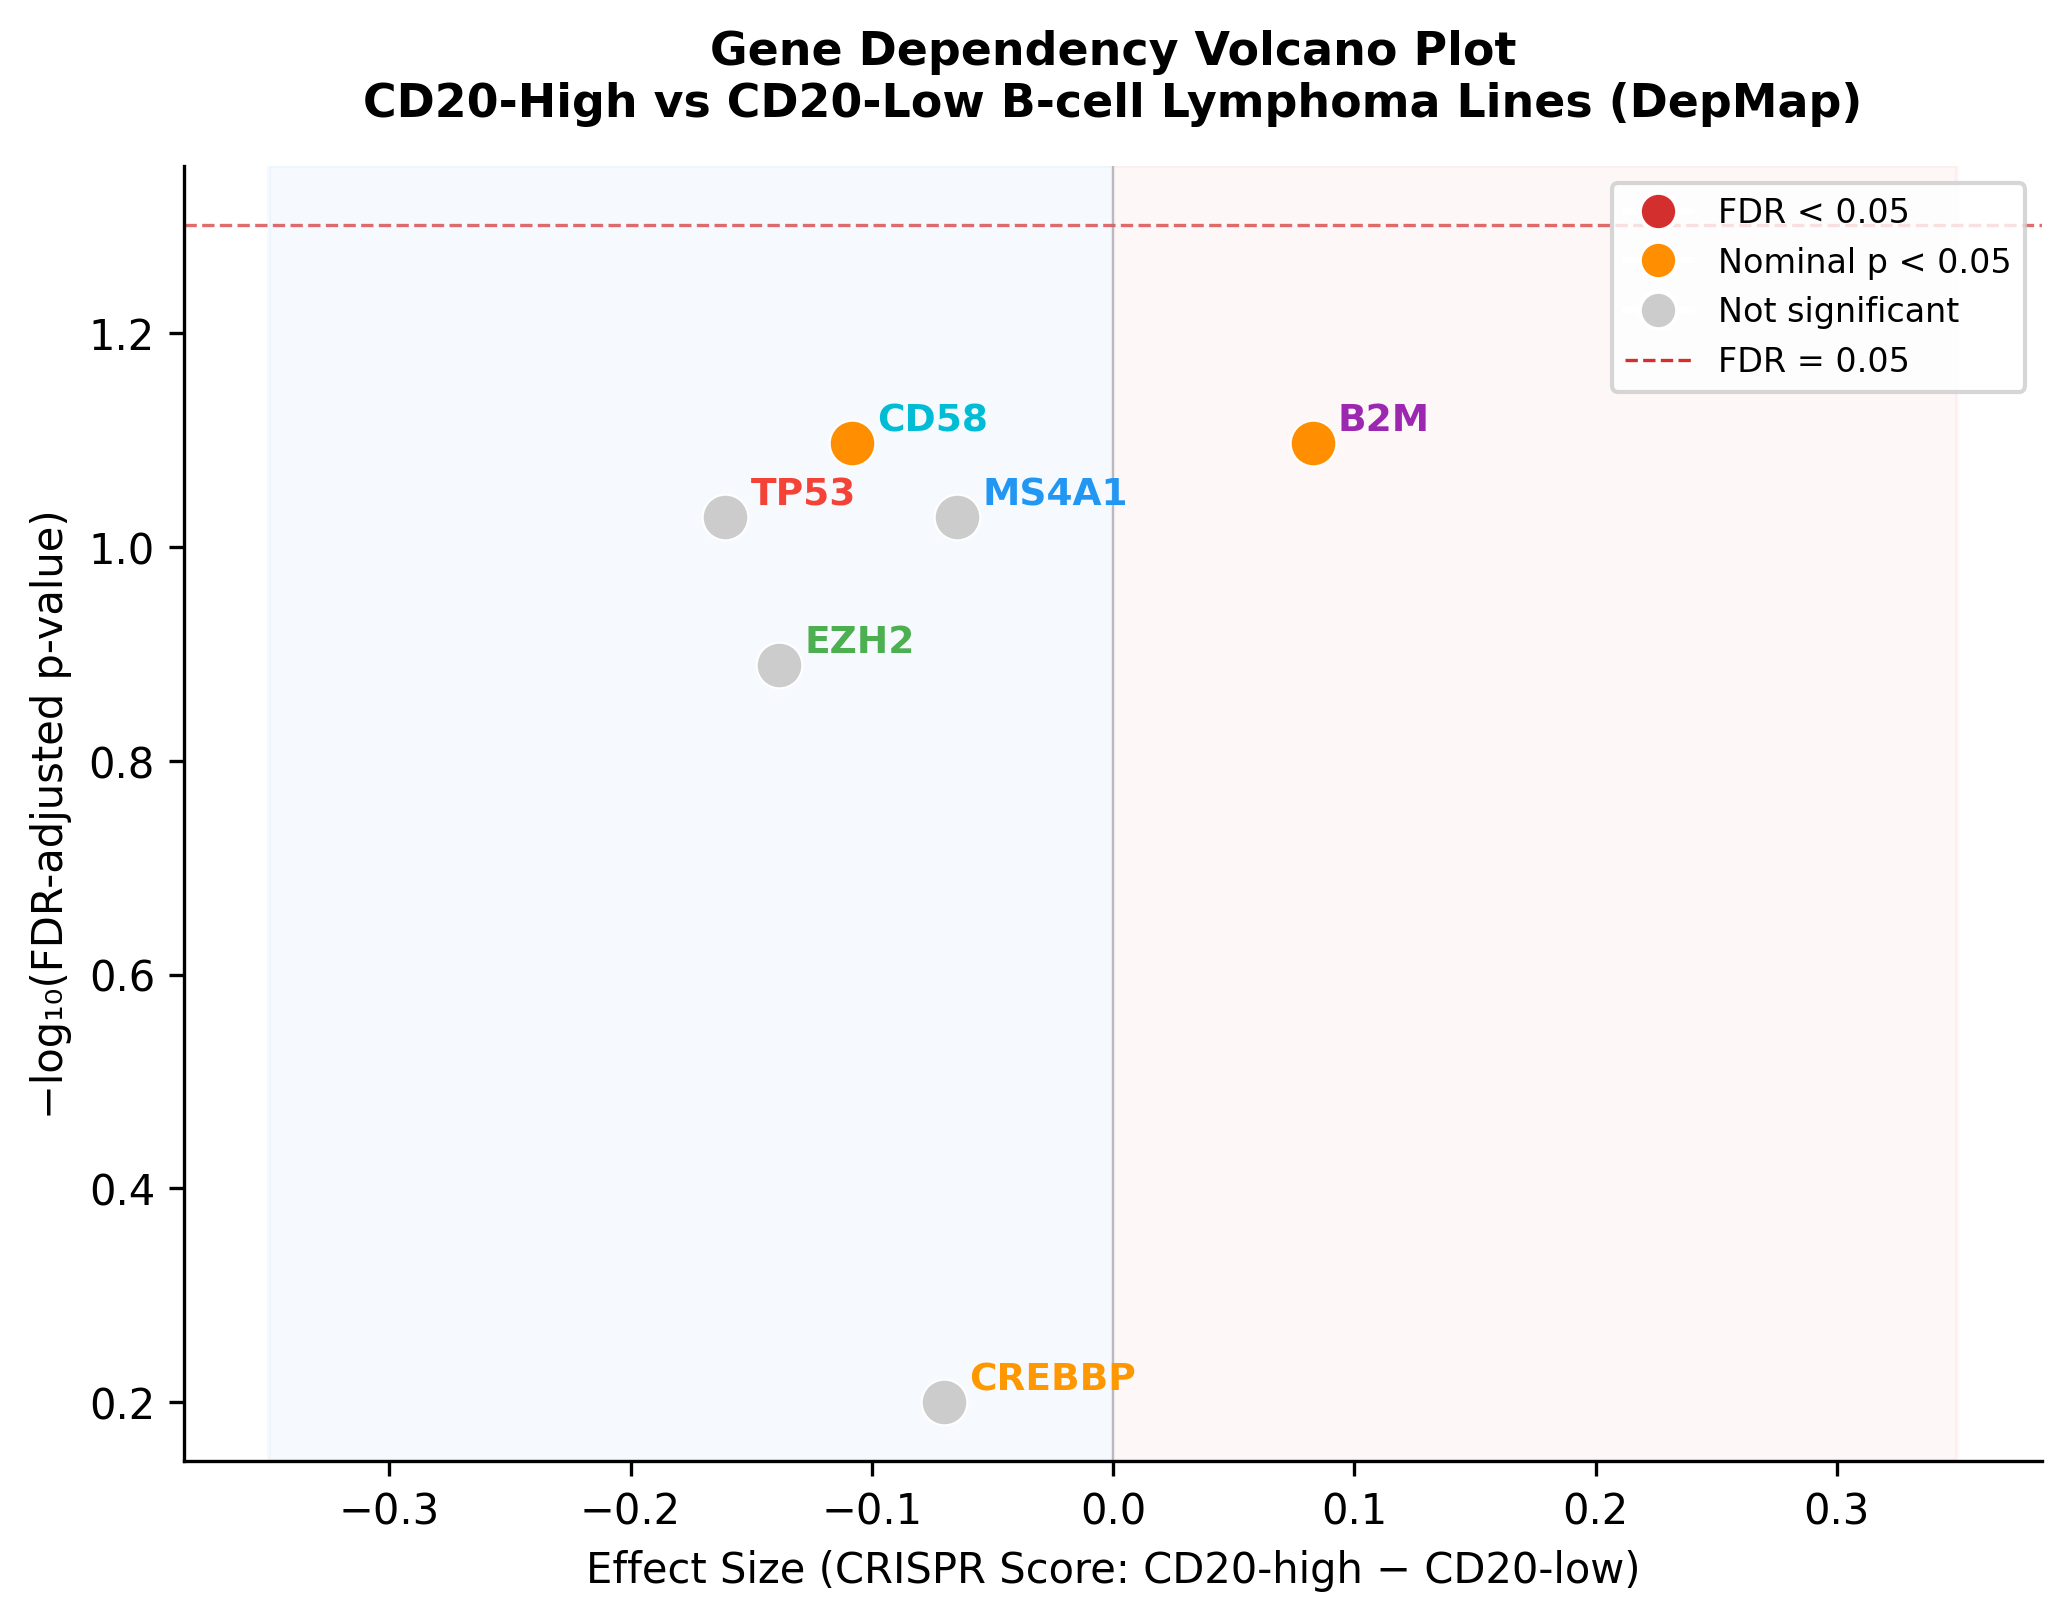
Volcano plot of DepMap CRISPR gene dependency differences (CD20-high vs. CD20-low). B2M and CD58 show nominal significance (orange) but do not survive FDR correction (red dashed line).
Clinical Efficacy: Bispecific Antibody Trial Landscape
The pipeline pulled trial data for three key bispecific antibody studies and merged it with published efficacy results:
| Trial | Drug | Indication | ORR | CR | Source |
|---|---|---|---|---|---|
| NCT04408638 | Glofitamab | R/R DLBCL | 52.0% | 39.4% | Dickinson et al., NEJM 2022 |
| NCT04676360 | Mosunetuzumab | R/R FL | 80.0% | 60.0% | Budde et al., Lancet Oncol 2022 |
| NCT03677141 | Mosunetuzumab | R/R NHL | 64.1% | 43.4% | Bartlett et al., Nat Med 2021 |
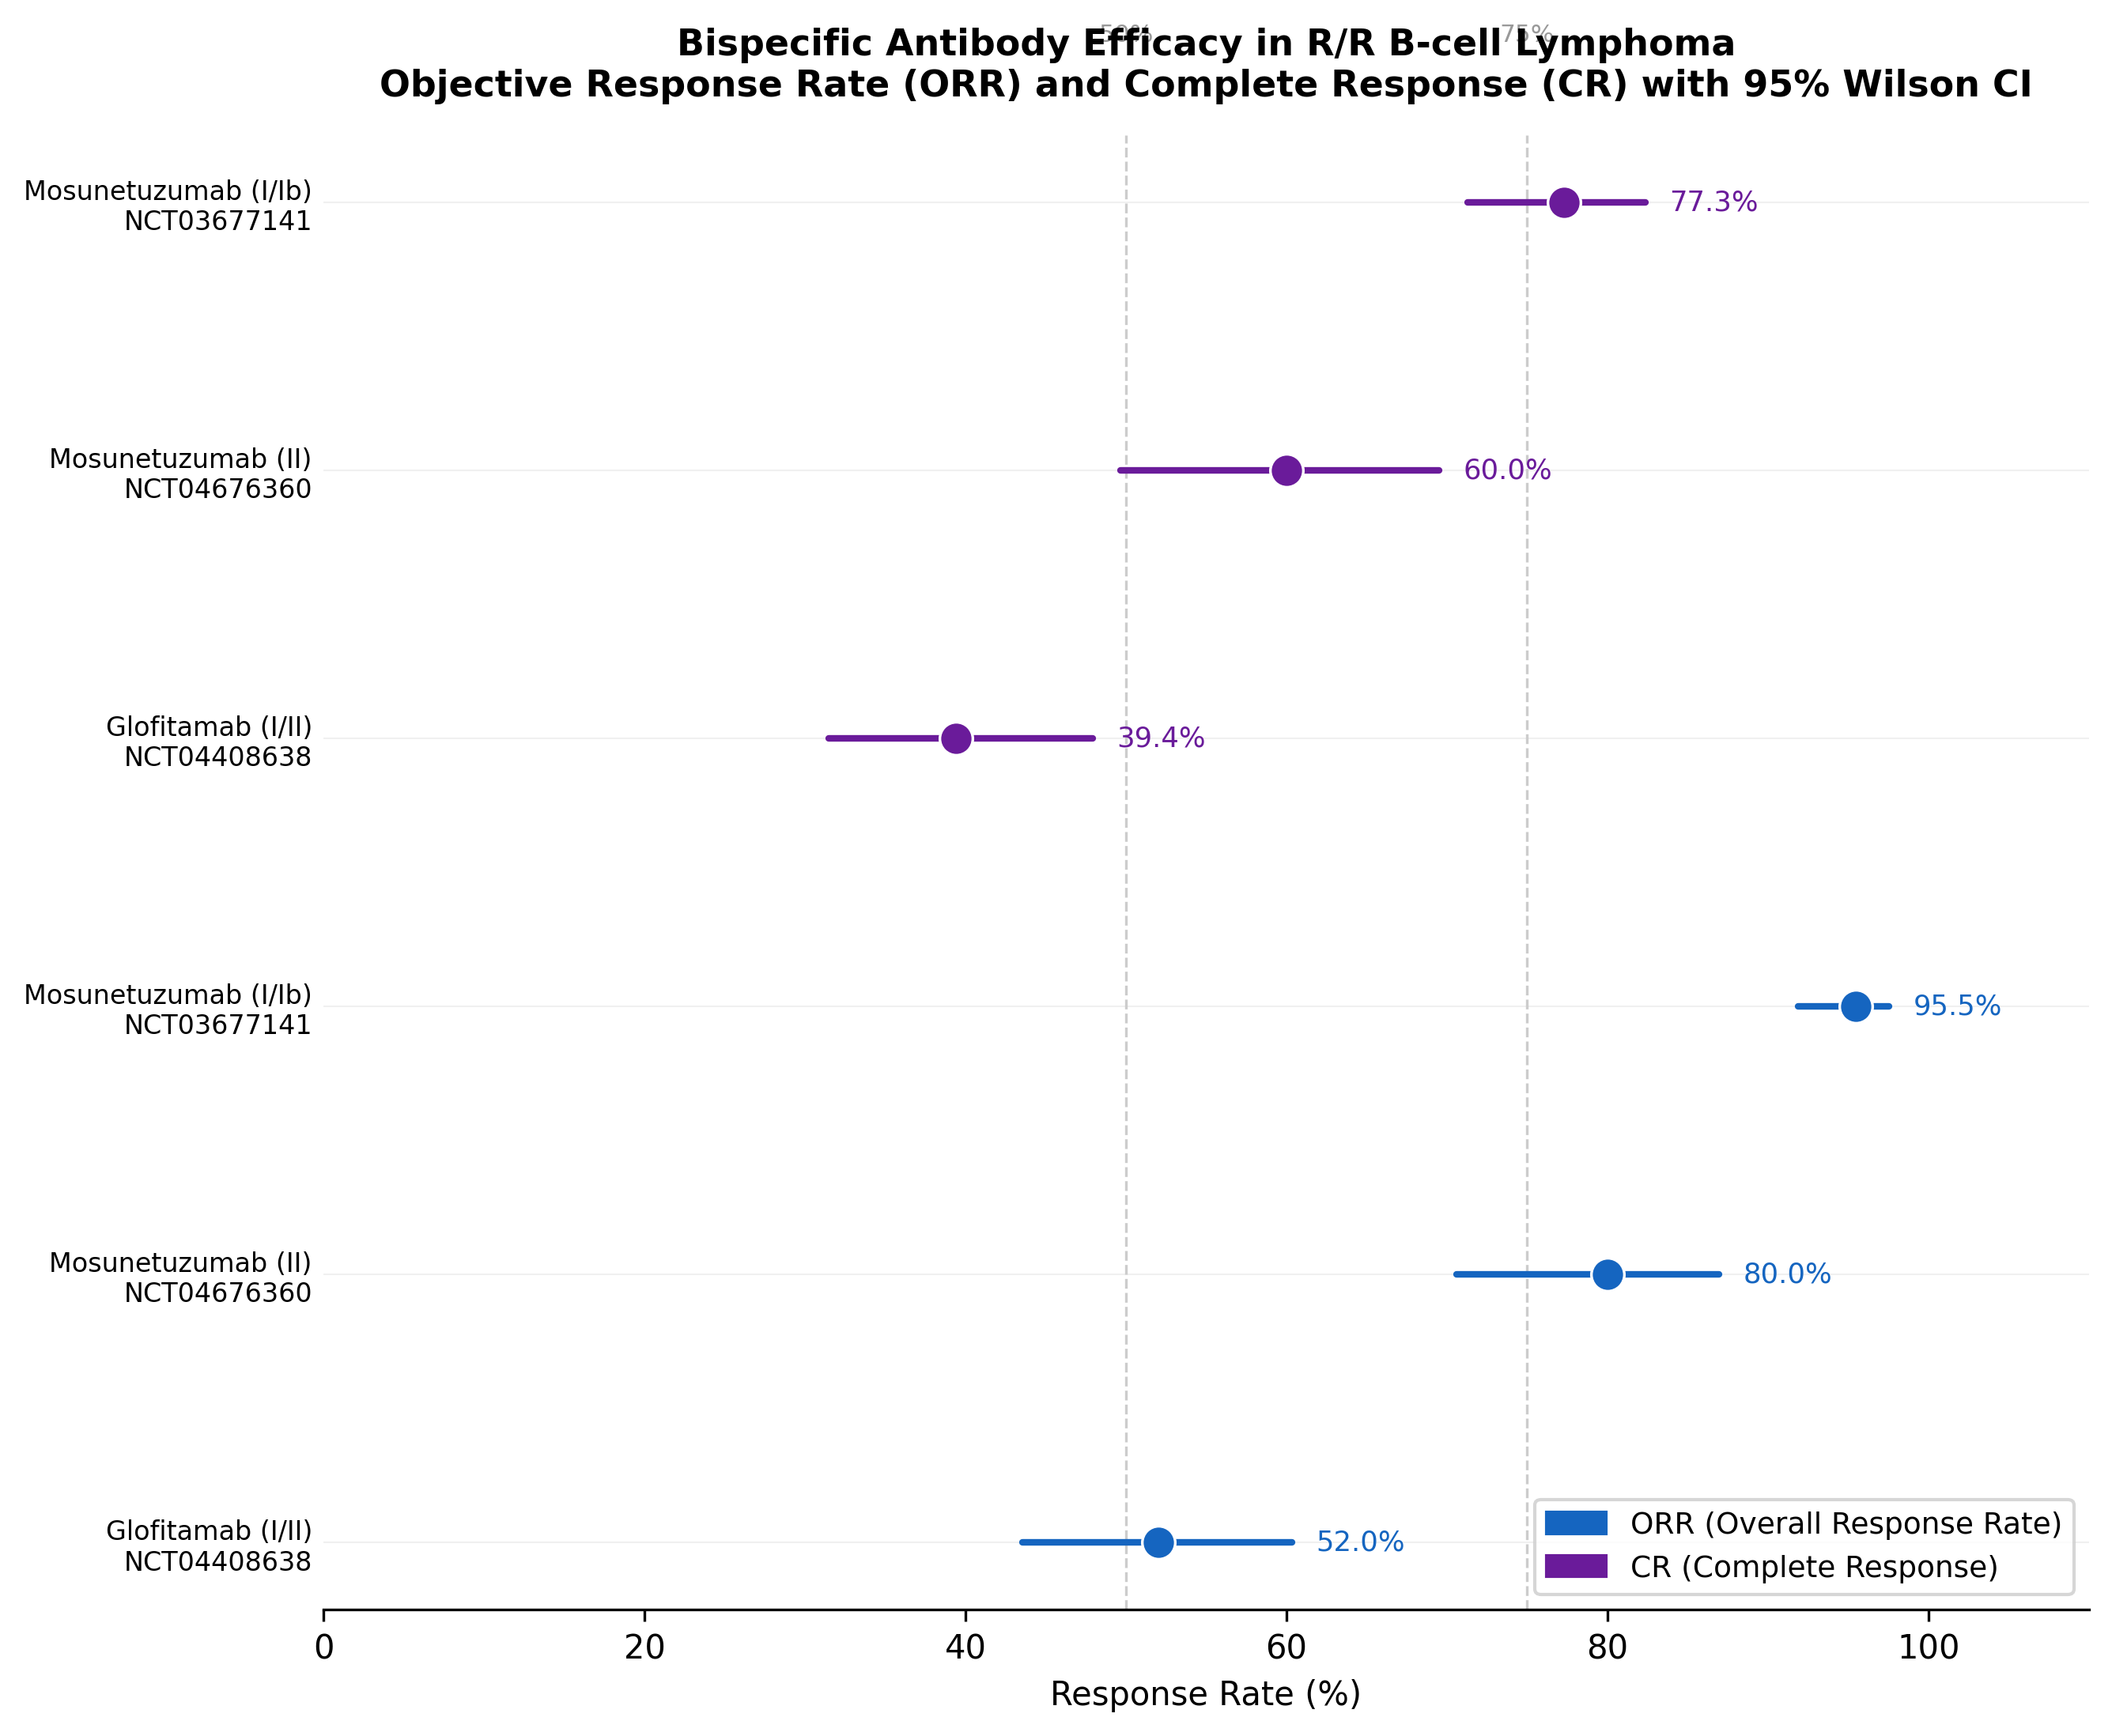
Forest plot of bispecific antibody efficacy. Mosunetuzumab in FL achieves the highest response rates (80% ORR, 60% CR), while glofitamab in the harder-to-treat DLBCL population reaches 52% ORR.
Safety Signals: FAERS Adverse Event Mining
Cytokine release syndrome (CRS) is the dominant safety concern with CD20×CD3 bispecific antibodies. K-Dense Web queried the openFDA FAERS database and found:
| Drug | Total Reports | CRS Reports | CRS % | ICANS Reports | ICANS % |
|---|---|---|---|---|---|
| Glofitamab | 1,839 | 578 | 31.4% | 85 | 4.6% |
| Mosunetuzumab | 783 | 165 | 21.1% | 6 | 0.8% |
Glofitamab's higher CRS reporting rate (31.4% vs. 21.1%) and notably higher ICANS rate (4.6% vs. 0.8%) provide important context for Phase III trial safety monitoring and support the need for biomarker-guided patient selection that could reduce unnecessary toxicity exposure.
Biomarker Pathway Network
The six candidate genes map onto a rich network of immune evasion and epigenetic regulation pathways. K-Dense Web generated a network diagram connecting each gene to its relevant biological functions in DLBCL:
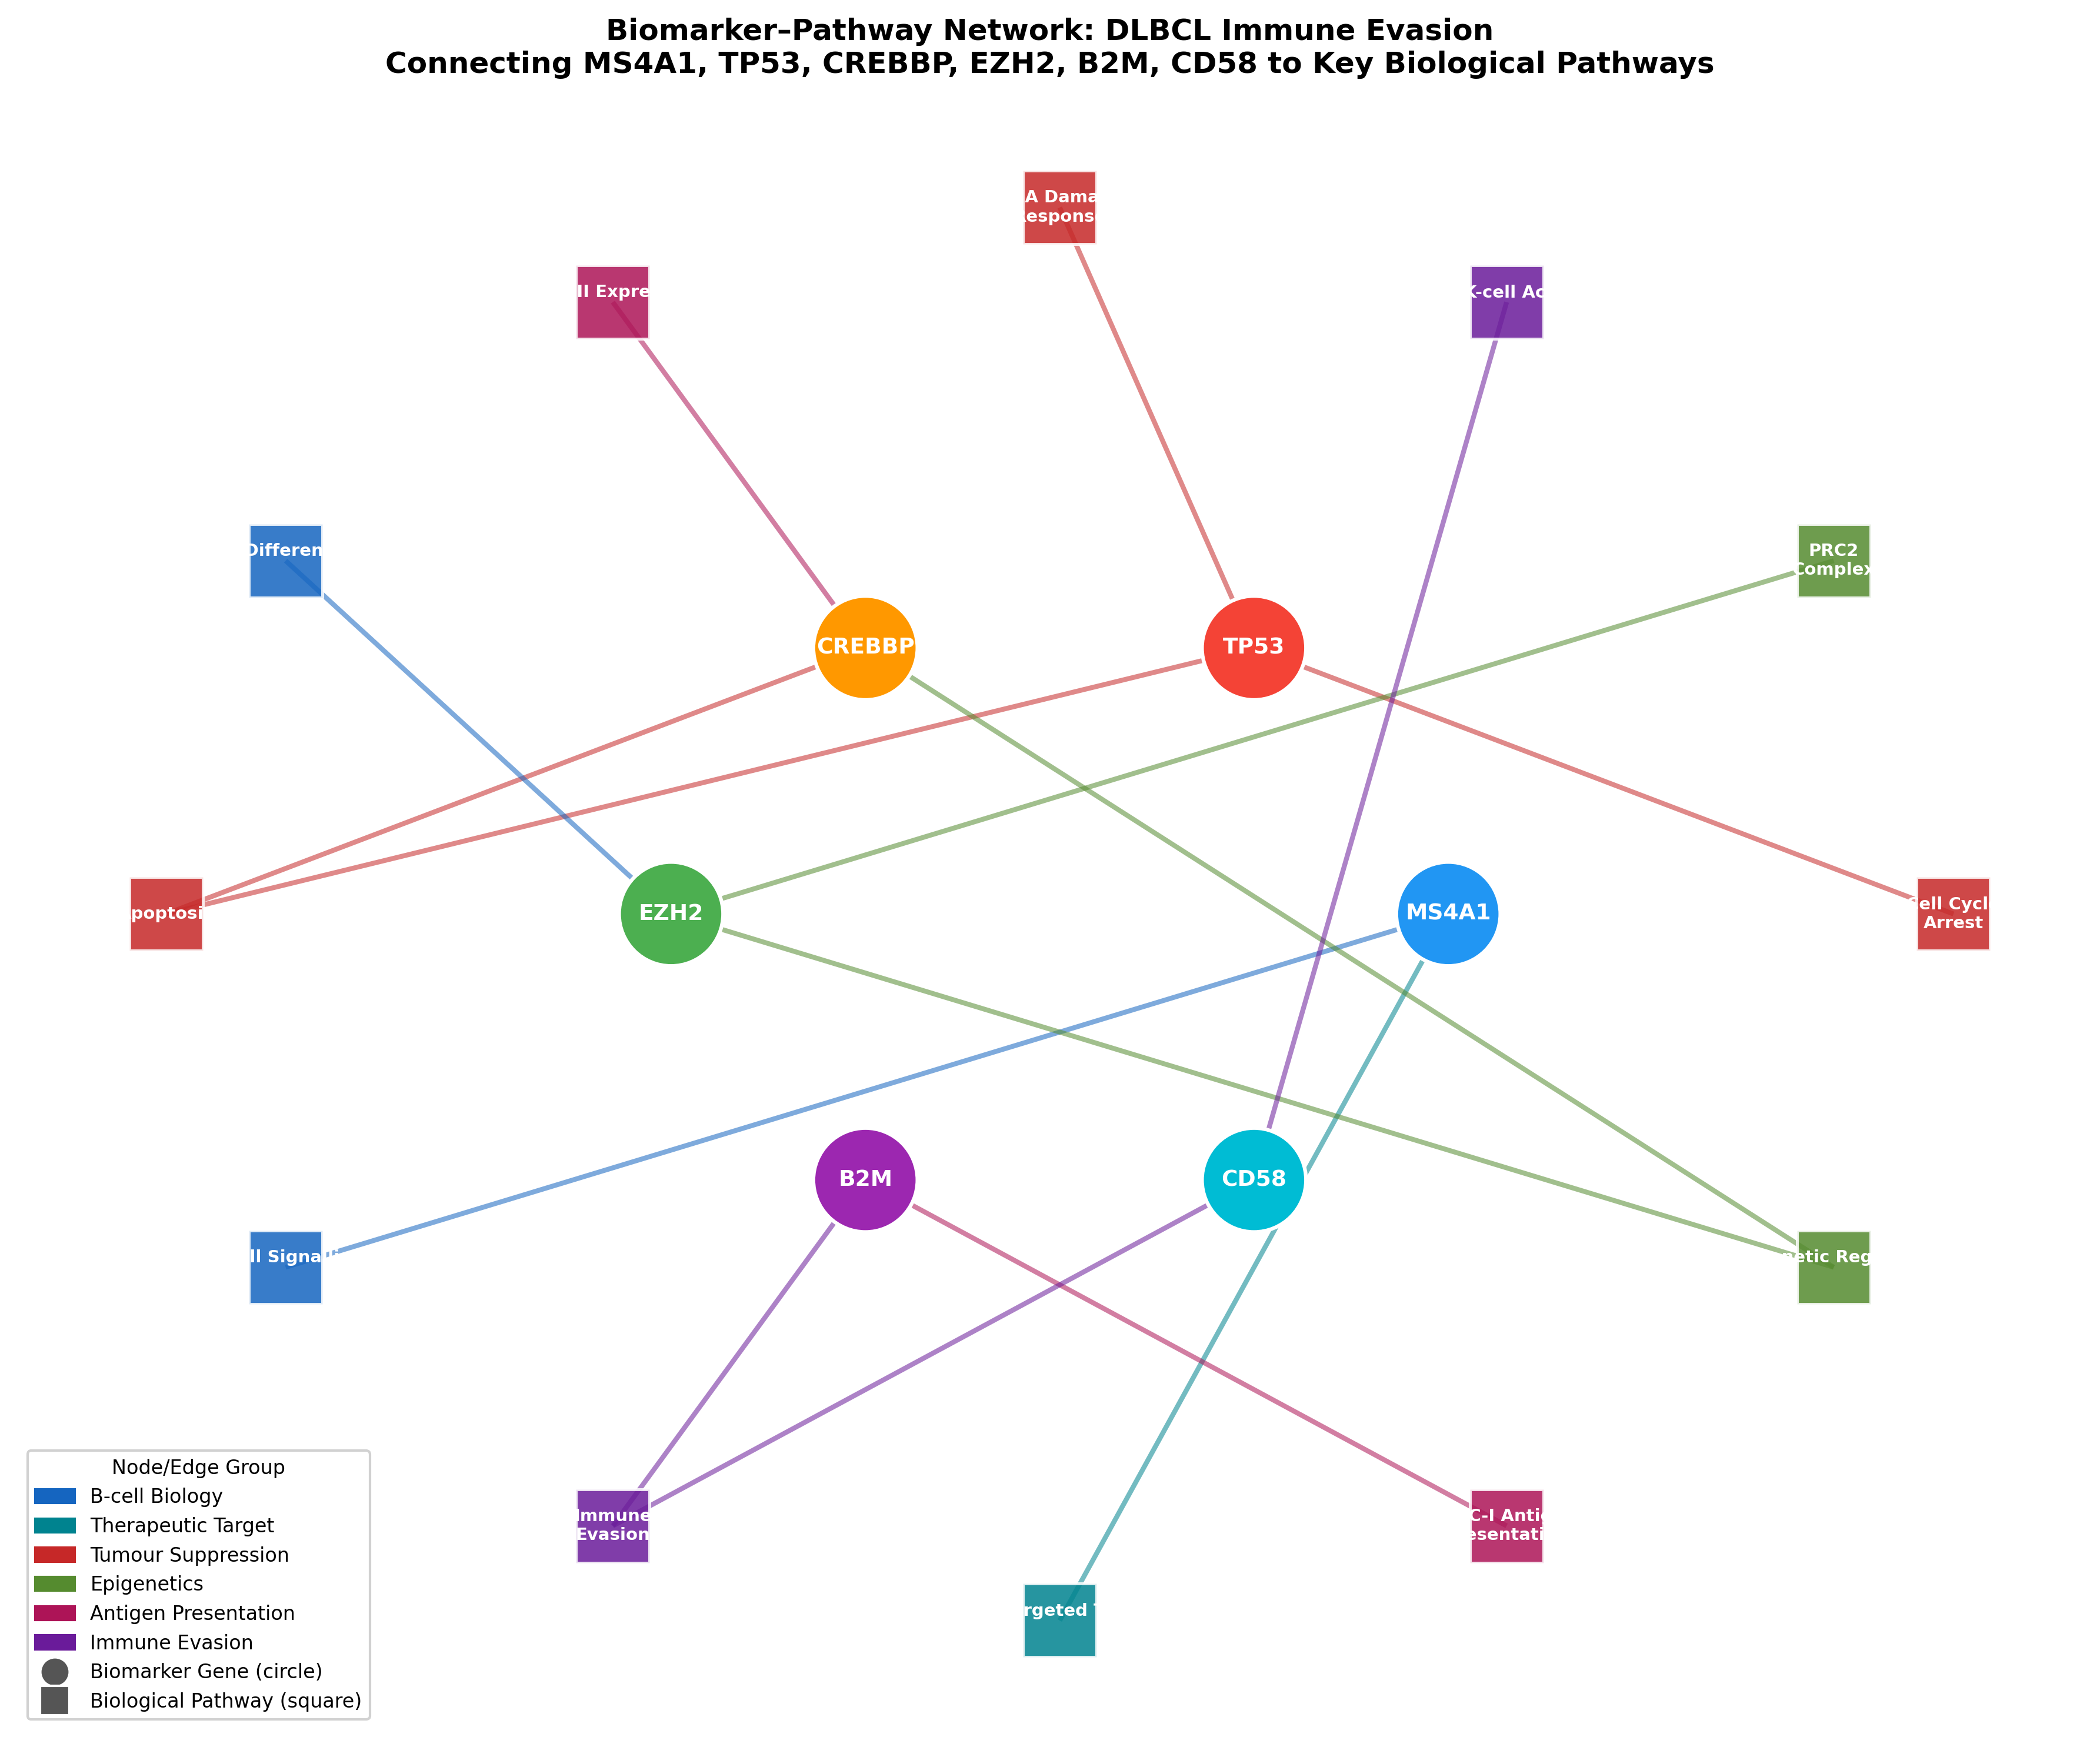
Biomarker-pathway network showing how the 6 candidate genes connect to immune evasion, epigenetic regulation, antigen presentation, and B-cell biology. Node colors indicate pathway groups.
CREBBP and EZH2 converge on epigenetic regulation and immune evasion. B2M and CD58 connect through MHC-I antigen presentation and immune evasion, providing a biological rationale for why their loss could impair bispecific antibody-mediated T-cell killing.
The Composite Ranking
K-Dense Web integrated all evidence streams into a single composite score per gene, using four weighted components:
| Component | Weight | Source |
|---|---|---|
| Genomic Prevalence | 30% | cBioPortal mutation frequency |
| Functional Dependency | 25% | DepMap CRISPR Chronos scores |
| Target Tractability | 30% | Open Targets priority score |
| Literature Evidence | 15% | PubMed publication counts (log-transformed) |
Each component was Min-Max normalized to [0, 1], with all dimensions oriented so that higher values indicate stronger biomarker evidence. The final rankings:
| Rank | Gene | Genomic | Functional | Tractability | Literature | Composite |
|---|---|---|---|---|---|---|
| 1 | CREBBP | 1.000 | 0.756 | 0.521 | 0.247 | 0.682 |
| 2 | EZH2 | 0.483 | 1.000 | 0.734 | 0.403 | 0.675 |
| 3 | TP53 | 0.878 | 0.000 | 0.719 | 0.438 | 0.545 |
| 4 | MS4A1 | 0.000 | 0.320 | 1.000 | 1.000 | 0.530 |
| 5 | B2M | 0.483 | 0.453 | 0.463 | 0.000 | 0.397 |
| 6 | CD58 | 0.238 | 0.539 | 0.000 | 0.000 | 0.206 |
CREBBP ranks first with the highest mutation prevalence (12.4%) and strong functional essentiality, making it the top candidate for a resistance biomarker.
EZH2 ranks second with the strongest CRISPR dependency of any gene tested (Chronos = -0.387) and an already-approved targeted inhibitor (tazemetostat), giving it excellent therapeutic actionability.
TP53 ranks third on genomic prevalence and tractability alone. Its near-zero CRISPR essentiality reflects the known biology: TP53-mutant lymphomas are biologically independent of TP53 for survival.
MS4A1/CD20 ranks fourth. As the bispecific antibody target itself, it has perfect tractability and dominant literature evidence, but zero somatic mutations in treatment-naive cohorts. CD20 antigen loss is an acquired resistance mechanism that emerges under therapy, not a baseline genomic feature captured by cBioPortal.
Phase III SAP Recommendations
The final step translated these rankings into concrete trial design recommendations:
| Role | Gene | Composite Score | DLBCL Prevalence | CDx Pathway |
|---|---|---|---|---|
| Primary Stratification | CREBBP | 0.682 | 12.4% | LDT via FoundationOne Heme |
| Primary Stratification | EZH2 | 0.675 | 6.0% | FDA-approved cobas EZH2 (Roche) |
| Secondary Stratification | TP53 | 0.545 | 10.9% | Existing NGS panels + IHC |
| Mandatory Eligibility | MS4A1/CD20 | 0.530 | ~95% expression | FDA-approved SP11 IHC |
| Exploratory | B2M | 0.397 | 6.0% | Archival tissue collection |
| Exploratory | CD58 | 0.206 | 3.0% | Archival tissue collection |
The enriched subgroup (CREBBP-mutant OR EZH2-mutant) represents approximately 17.7% of the relapsed/refractory DLBCL population, yielding an estimated 2,207 eligible US patients per year. A Phase III trial of roughly 300 ITT patients would provide approximately 80% power to detect a hazard ratio of 0.70 for PFS in this enriched subgroup (log-rank, alpha = 0.05, two-sided), with co-primary PFS and OS endpoints and Hochberg gate-keeping for alpha allocation.
The companion diagnostic strategy spans three tiers: Tier 1 uses existing FDA-approved assays (cobas EZH2, SP11 IHC for CD20), Tier 2 develops a CREBBP LDT through FoundationOne Heme or a custom NGS panel before Phase III launch, and Tier 3 collects archival FFPE tissue for exploratory B2M and CD58 analysis.
What This Pipeline Replaced
Traditionally, assembling this kind of multi-omic biomarker analysis requires a team of bioinformaticians, clinical scientists, and regulatory strategists working across weeks or months. The data acquisition alone (querying 6 different APIs, downloading 700+ MB of DepMap data, parsing clinical trial records, mining FAERS) typically takes days of scripting and debugging.
K-Dense Web ran the full pipeline in a single session. It designed the analysis strategy, wrote 9 Python scripts, applied appropriate statistical corrections (Benjamini-Hochberg FDR, Fisher's exact test, Mann-Whitney U), caught and fixed its own methodology error in the prevalence calculation, generated 4 publication-quality figures, and produced a 34-page white paper with 48 verified citations.
The output is a complete, actionable biomarker dossier: from raw genomic data to Phase III trial design parameters, ready for review by a clinical development team.
Get the Full Analysis
The complete white paper includes detailed methods, all figures and tables, a full discussion section, and 48 citations.
Questions? Contact us at contact@k-dense.ai